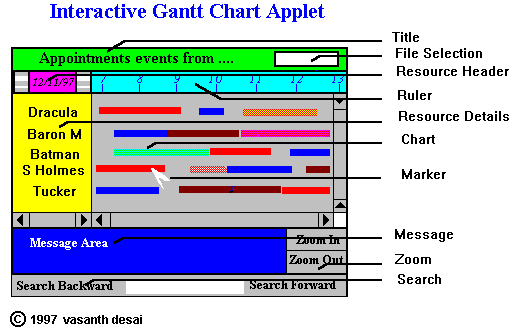
Features of the Applet
C_CHARTS is written entirely in Java 1.0.2.
Therefore it will run on almost all Java enabled browsers(Nestscape 3, IE 3).
Considering its functionality it is very lean.The Applet consists of
just ten classes and 34KB of code.
It easily integrates with other applications.
The Applet uses simple free formatted line oriented data files.
Applications which want to incorporate C_CHARTS as frontend, do not
have to bother about C_CHARTS API. They need not even be Java applications.
Any application can generate the data for C_CHARTS. You can even prepare
the data with a text editor, as I did for the demo.
It is highly configurable.
Webpage designers can configure the Applet to suite the page.
Border style,background and forground colors, fonts of almost all
subcomponents of the Applet can be configured. The actual chart area
in which the activities/events are displayed can be decided by the
designer by changing size of the Applet. Chart title can also be
specified by the designer.
It is easy to pan across time.
Scrollbar at the bottom of the chart enables the user to bring any
time window in to view easily. Mini scrollbars by the side of date display
enable to change time by days and month
Activity tracking
Search buttons allow job tracking and bring any activity having search
text in its description into chart area.
ZoomIn/ZoomOut
When a datafile is initially displayed, the duration of the chartwindow corresponds
to 12 hours. By clicking the ZoomOut button, the user increases the duration and
by clicking the ZoomIn button, the user decreases the duration.(When the chart
spans the entire time horizon of the activities in the file,the ZoomOut button becomes ineffectual. When the chart
duration becomes one hour the ZoomIn button becomes ineffecive.
MessagePanel
The MessagePanel at the bottom of the chart is used to display results of
datafile reading, details of the activities.
When the user clicks on an activity in the chart area, its information is
shown in the MessagePanel. If the user clicks on empty area the corresponding
time is shown. The point of click is indicated by
a marker 'voodo' arrow.
Chart and its contents


